Tools
Trace Tools
- SystemTap
- LTTng
- GDB
- ktap
- dtrace4linux
- Oracle Linux Dtrace
- sysdig
Trace frameworks
- Ftrace
- perf_events (perf)
- eBPF
Trace source
- tracepoints – kernel static tracing
- kprobes – kernel dynamic tracing
- uprobes – user-level dynamic tracing
Trace history
- 초기: Static tracers, prototype dynamic tracers
- 2004: Linux kprobes (2.6.9)
- 2005: Solaris DTrace (s10)
- 2008: Linux ftrace (2.6.27)
- 2009: Linux perf (2.6.31)
- 2009 tracepoints (2.6.32)
- 2010~2014: ftrace & perf_events enhancements
- 2014: eBPF patches
(참고: Brendan Gregg – Linux Performance Analysis: New Tools and Old Secrets)
Kernel Option
Kernel hacking  --→
	[*] Tracers  --→
		-*-   Kernel Function Tracer
		[*]     Kernel Function Graph Tracer
		[*]   Interrupts-off Latency Tracer
		[ ]   Preemption-off Latency Tracer
		[*]   Scheduling Latency Tracer
		[ ]   Trace syscalls
		-*-   Create a snapshot trace buffer
		-*-     Allow snapshot to swap per CPU
   	            Branch Profiling (No branch profiling)  --->
		[*]   Trace max stack
		[*]   Support for tracing block IO actions
		[ ]   Enable kprobes-based dynamic events
		[ ]   Enable uprobes-based dynamic events
		[*]   enable/disable function tracing dynamically
		[*]   Kernel function profiler
		[ ]   Perform a startup test on ftrace
		[ ]   Add tracepoint that benchmarks tracepoints
		< >   Ring buffer benchmark stress tester
		[ ]   Ring buffer startup self test
Dependency
- 프로파일링: 커널 빌드 시 gcc의 -pg 옵션을 사용하여 추가적인 프로파일링 코드를 생성하고 이를 통해 함수들의 분석을 돕는다.
- mount -t debugfs none /sys/kernel/debug
- CONFIG_DEBUG_FS
- CONFIG_FUNCTION_PROFILER
- CONFIG_FTRACE
- CONFIG_KPROBES (dynamic kernel tracing)
Visual Tools
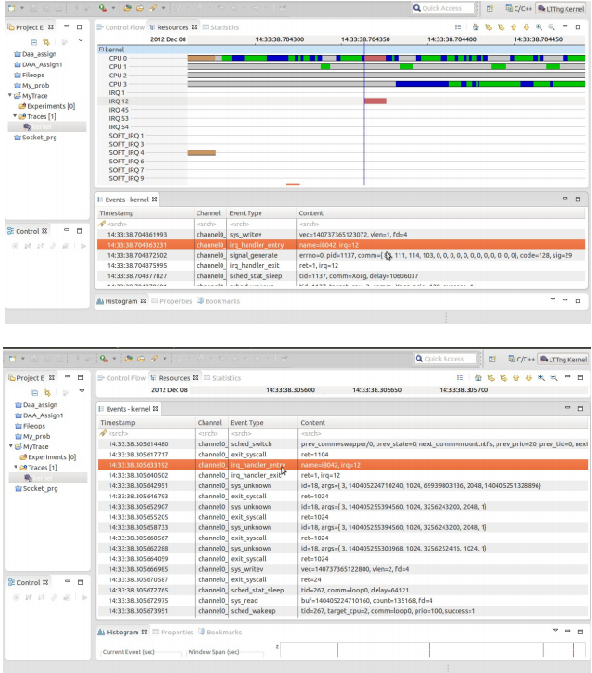
KernelShark

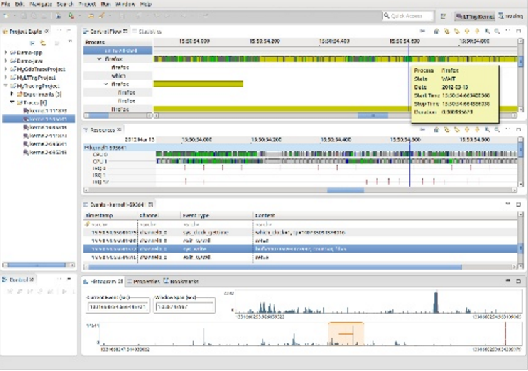
Trace Compass
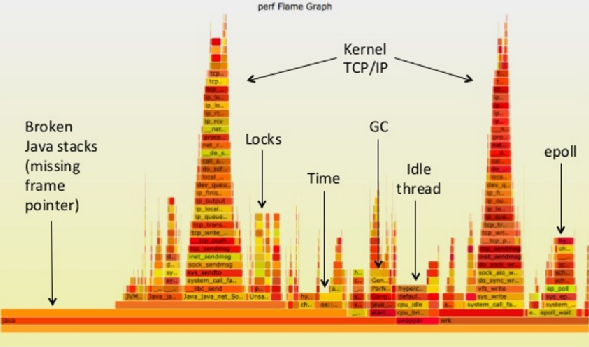
perf CPU Flame Graph
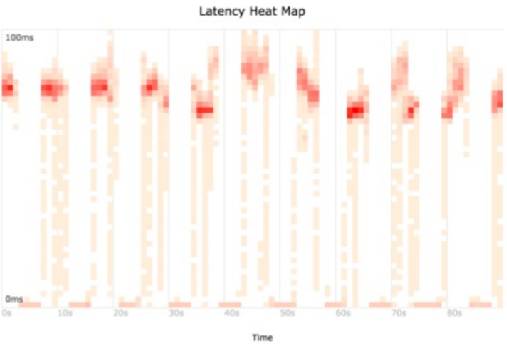
perf Block I/O Latency Heat Map
LTTviewer
참고